|
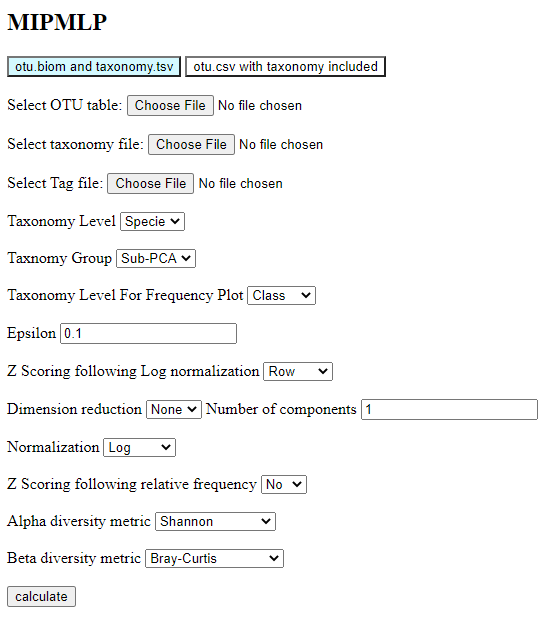
When performing MIP-MLP, one has to select ten choices:
A. The taxonomy level used (we propose as a default Genus or Specie).
B. The grouping methods (we propose as a default sub-PCA).
C. Normalization log or relative (we propose log as a default). If using log, one must put a minimal value
(epsilon, we propose epsilon = 0.1).
D. Z scoring on either rows or columns or both. This has a limited effect on the results.
E. Dimension reduction ICA/PCA or None (we propose as a default none).
When choosing dimension reduction in PCA or ICA, one must choose the number of dimensions.
F. Normalization Log/Relative (we propose as a default Log).
G. Z Scoring following relative frequency No/Yes (we propose as a default No).
H. The taxonomy level used for the relative frequency plot (we propose class as a default)
I. The metric for the Alpha diversity calculation (we suggest Shannon as a default).
J. The metric for the Beta diversity calculation (we suggest Bray-Curtis as a default,
since Unifrac can be a bit slow).
The output will contain visualizations of the results, as well as a preprocessed file.
Here is an example of running:
Step 1: Download the example input files and enter each to his fit place:
Step 2: Choose the running options like those in the image:
|
|
|
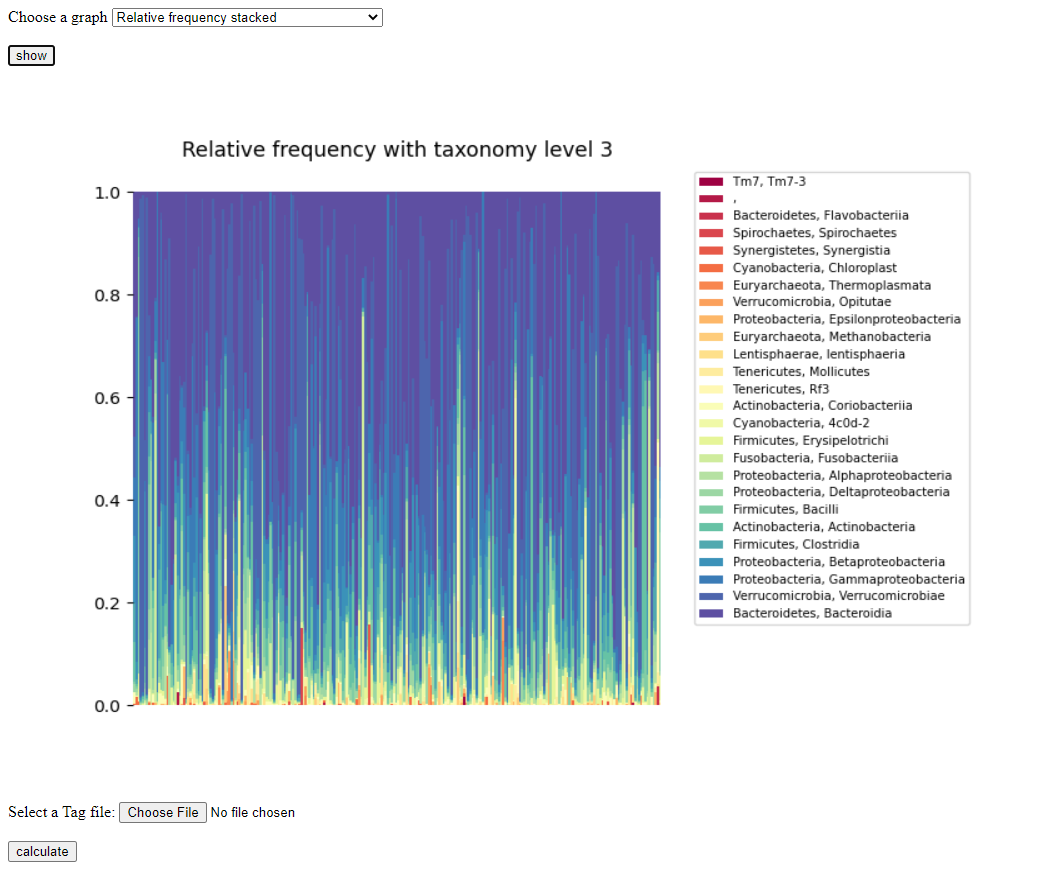
You may now choose the plot that you would like to view:
First figure is a heatmap of the correlation between the merged taxonomies.
Second figure is a heatmap of the correlation between samples.
Third figure is a heatmap of the normalized samples.
Fourth figure is a histogram of the variance of samples.
Samples with very low variance should probably be removed.
Fifth figure is a histogram of the total number of reads per sample.
Samples with very low total number of reads should probably be removed.
Sixth figure is a plot of the prevalence of each taxonomic unit (Phylum, Class, Order) in each person.
Seventh only appears when a tag file is given,
and it represents the correlation between the grouped taxonomies and the tag.
If a tag file is not given, it Will tell you that no tag file is given,
and you may add a tag file and calculate. After that, the figure will appear.
After you've chosen your plot, it should look like this:
|
|